MRCI's Market Seasonal Pattern Charts reflect seasonal patterns for individual futures markets over the period of a calendar year. Each market is represented by its nearby contract (until rollover).
The MRCI charting algorithm tracks the nearest contract either until First Notice Day (FND), if settled by delivery prior to expiry, or until five days before expiration, if settled to cash or by delivery only after expiry (for example, S&P 500 or sugar). The contract month plotted in each segment of the pattern is designated at the top of the chart immediately below its title, with rollover designated by a small vertical line. Thus, sharp declines or inclines at rollover may reflect consistent discounts/premiums in the succeeding contract and/or market behavior after FND. The twelve months of the year are displayed on the bottom of the chart, with calendar year 2005 used to affix dates for FND and expiry.
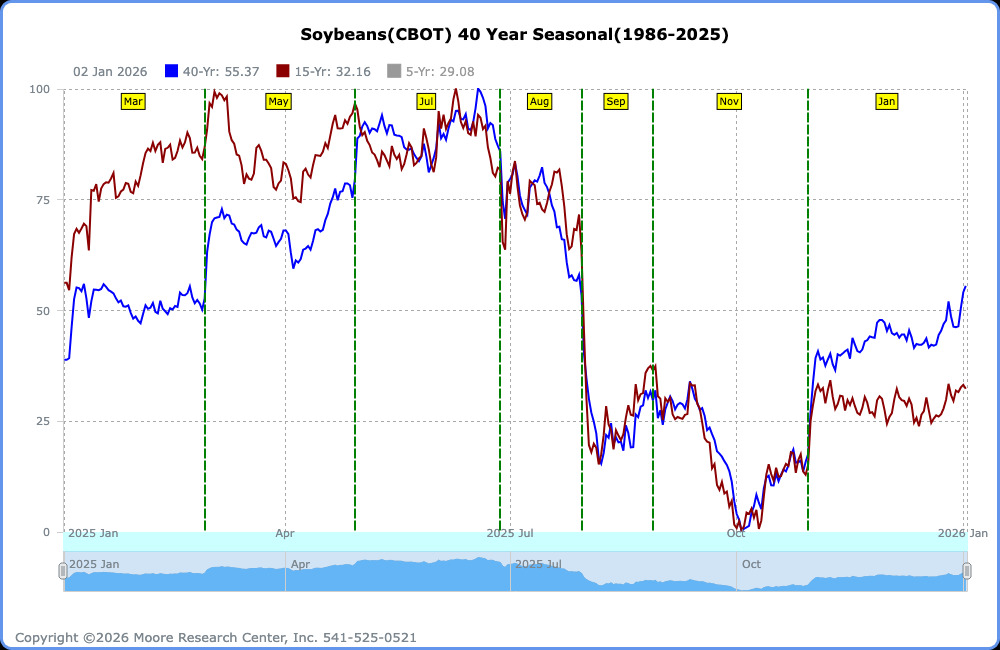
Each of the charts exhibits two seasonal patterns: the most recent 15 years (dotted line) and up to the last 40 years (solid line), depending on how long the contract has actually traded. A market which has traded for 15 or fewer years will show only one pattern.
Presenting two different time frames helps depict if/how the pattern for that market has evolved over time. Has the seasonal high or low shifted over time? Which seasonal trends, and segments thereof, have remained consistent?
Seasonal patterns are displayed against a numerical index from 0 to 100 (the right-hand vertical scale). The graph reaching 0 represents the seasonal low (the time of the year when prices are most consistently low); the graph at 100 represents the seasonal high (when prices are most consistently high). The graph at 20 represents when prices have tended to be in the lower 20% of the year's eventual price range.
MRCI seasonal patterns are constructed by plotting daily data against calendar days rather than simply averaging weekly and/or monthly data. Such daily data registered to the calendar has proven to be far more valuable when looking for consistent and precise entry and exit dates.
Using a Market Seasonal Pattern
The most basic elements of a seasonal pattern are its seasonal high, seasonal low, and seasonal trends in between. Traders may look further for consistent behavior associated with annual events, whether futures-related such as, a preceding contract's First Notice Day or expiration or otherwise such as holidays. Does a market tend to run into or out of it? Are there other identifiable conditions or events, such as harvest, which occur at about the same time as a peak or valley in the seasonal pattern? Do certain market axioms begin to make sense, such as "Peaks precede consumption?"
View a sample Market Seasonal Pattern Chart in PDF - here
Note: MRCI's Market Seasonal Pattern Charts are available for FREE for MRCI ONLINE subscribers - here