Correlation File: SAMPLE
1. How can I tell if a given future is behaving as it has in past years?
In the upper right-hand corner of any correlation chart you will find a small box that says at the
top "Correl > 84%" --- meaning "years correlating at a rate greater than 84%." Below that you will
find the contract years listed along with their rate of correlation.
2. Why are correlation charts available for some markets but not others? Does this mean that the
current year is not highly correlated with any previous year?
Correct, only those contracts which correlate with a past year at a rate of 84% or greater will show up.
3. I would like to know if there is an area in the website where I can chart the 1 year correlation for
any spread?
You can not chart the 1 year correlation for ANY spread or market as there may not even be a current
correlation.
Our correlations pages are updated nightly & show ALL current correlations. If a correlation is not showing up
for a particular market, it is because that market is NOT currently correlating with any past years.
Futures: http://www.mrci.com/client/correl/index.php
Spreads: http://www.mrci.com/client/scorrel/index.php
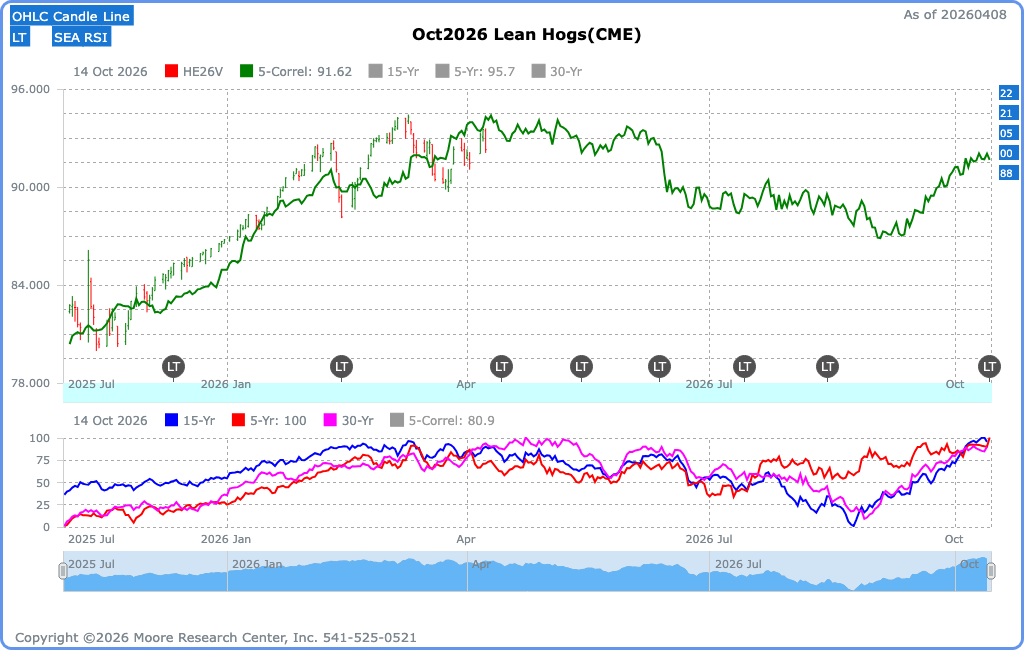
4. How do I read the GREEN line on your correlation charts?
For example on April 8, 2026, the Oct 2026 Lean Hogs Correlation chart (see below) says "5-Yr- Correl" at the top of the chart: What does the number "91.62" on the top of chart after "5-Yr Correl" mean?
The last data point on the green line is at 91.62. If you don't have your cursor within the boundaries of the chart, it will read the last data point. You will notice that, when your cursor is within the boundaries, that number will read differently --- reflecting the level of the green line on the particular date lined up by your cursor.
However, please know that this study does not suggest the contract will expire at 91.62. (It could do so only if the current market continued to follow the correlation pattern exactly to the degree it has been and also if the volatility remained exactly as it is. The use of any pattern, be it seasonal or correlation, is meant to suggest only timing and direction --- never a price objective.
*Please note for these explanation purposes see the Oct. 26 Lean Hog Correlation Chart below as it was posted on April 8, 2026.
Since correlations are always changing you will no longer be able to find these #'s live on our site.
5. A good way to also monitor new correlation studies is via our weekly MRCI Online Update.
Each week Steve Moore writes a short commentary on all of our new & current futures correlations.
For more information, please also visit MRCI's Seasonal Correlation Explanation & our MRCI Spread Tutorial https://www.mrci.com/tutorials/mrcispreads.pdf
(Correlations are discussed starting on Thumbnail 24.)
Remember that seasonal strategies present optimized dates and are static in that, no matter what the current market is doing, the seasonal strategy entry and exit remains fixed. Further, think of an optimized date as residing at the peak of a distribution bell curve: that date may not have been the best date in any of those 15 years but it did provide the best overall results if using only one single date in all 15 years.
In contrast, the correlation study is dynamic. It starts with the pattern of behavior exhibited so far by the current market and looks for similar behavior in prior years --- the theory being that those past years exhibiting similar behavior may have been responding to similar fundamentals of supply and demand and therefore how those years resolved those issues via trading behavior going forward might suggest how this year will resolve itself.
Remember, seasonal strategies are derived from history and have no input whatsoever from current market behavior whereas correlation studies are derived from current market behavior --- but are dynamic and therefore can change. MRCI can present the research but each trader has the luxury of using it however it best fits his/her trading style and expertise, his/her financial and time resources, his/her perspective of the market, and current market behavior.
7. MRCI's Intermarket Correlation Studies are located here: http://www.mrci.com/special/correl.php